We sell fast websites, so our own had to pass the same test we put client sites through. On 4 November 2026 Lighthouse scored the codevibe.in homepage 54 for mobile performance, with 79 for Best Practices and 96 for Accessibility.
Most of the cost was not our own code but what loaded alongside it: a 21,528 KiB hero film and 470 KiB of tag scripts, all fighting for a phone's bandwidth and CPU in the first seconds. Codevibe, a web development agency in Gurugram, moved the film and the tags behind the visitor's first interaction, removed one widget, inlined the LCP element, routed images through a CDN and fixed contrast. On 10 November PageSpeed Insights scored the homepage 99 on mobile and 100 on desktop, with Accessibility, Best Practices and SEO at 100 on both.
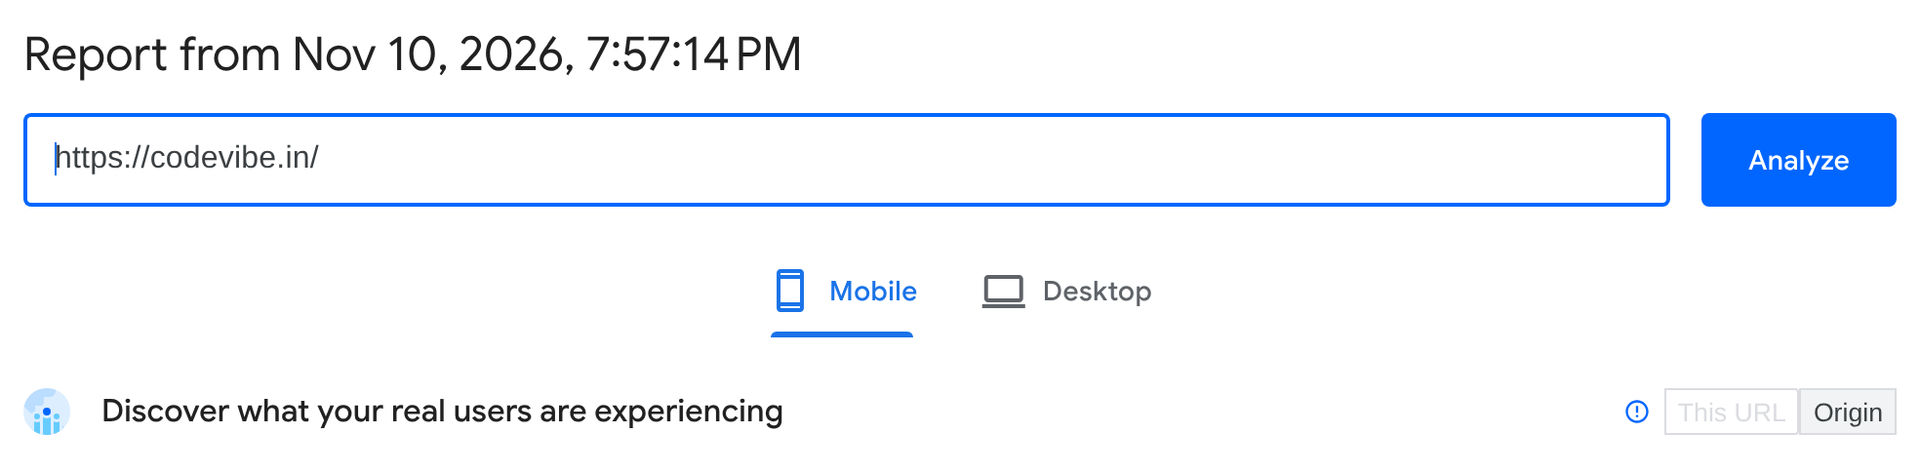
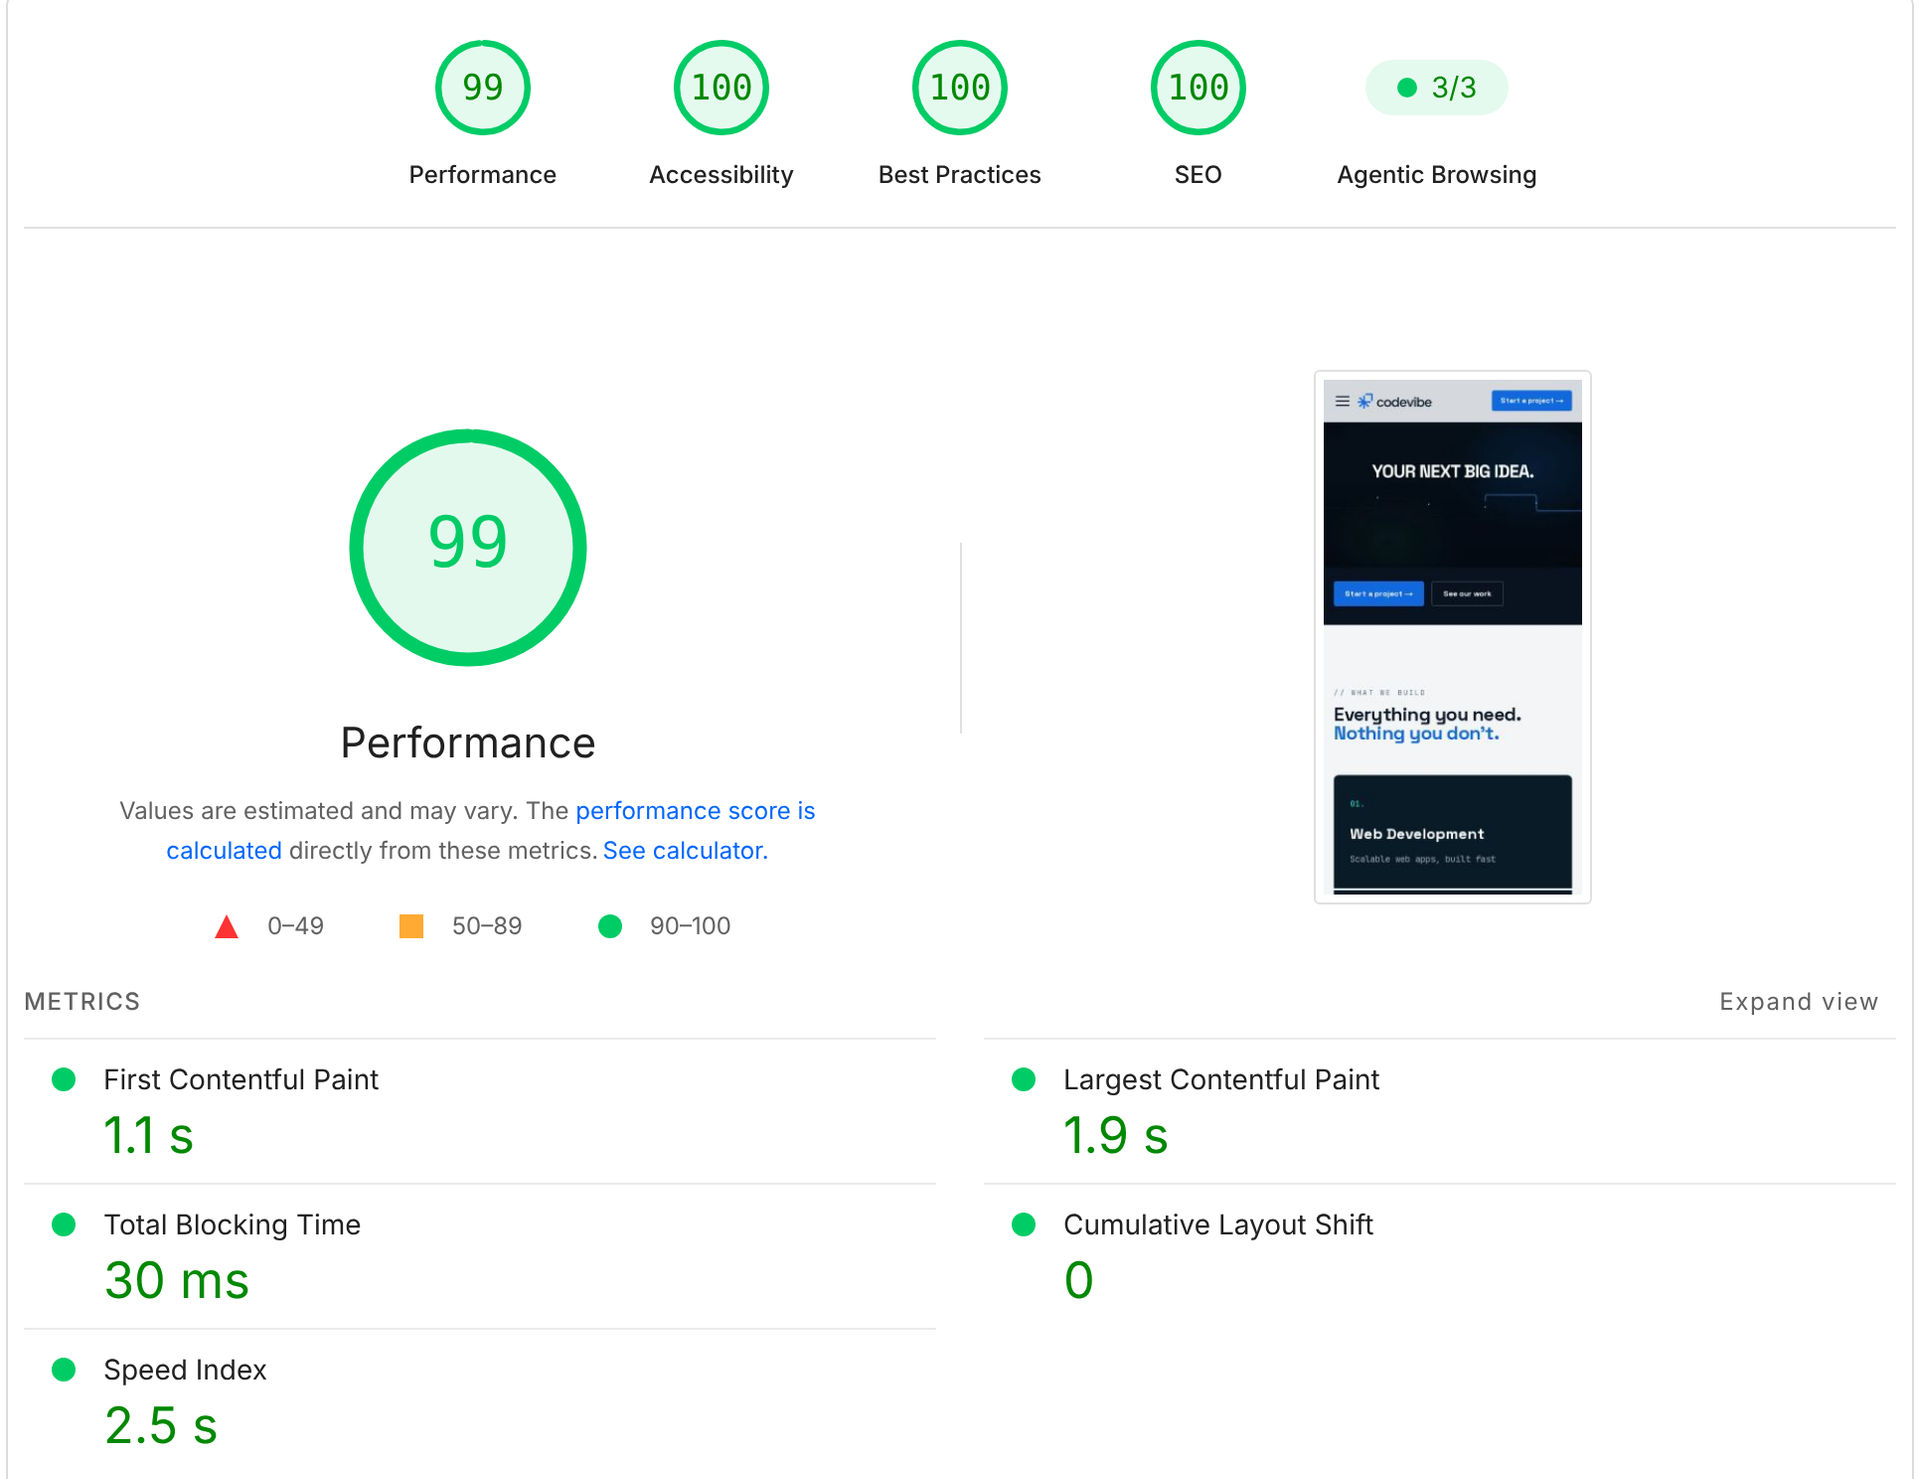
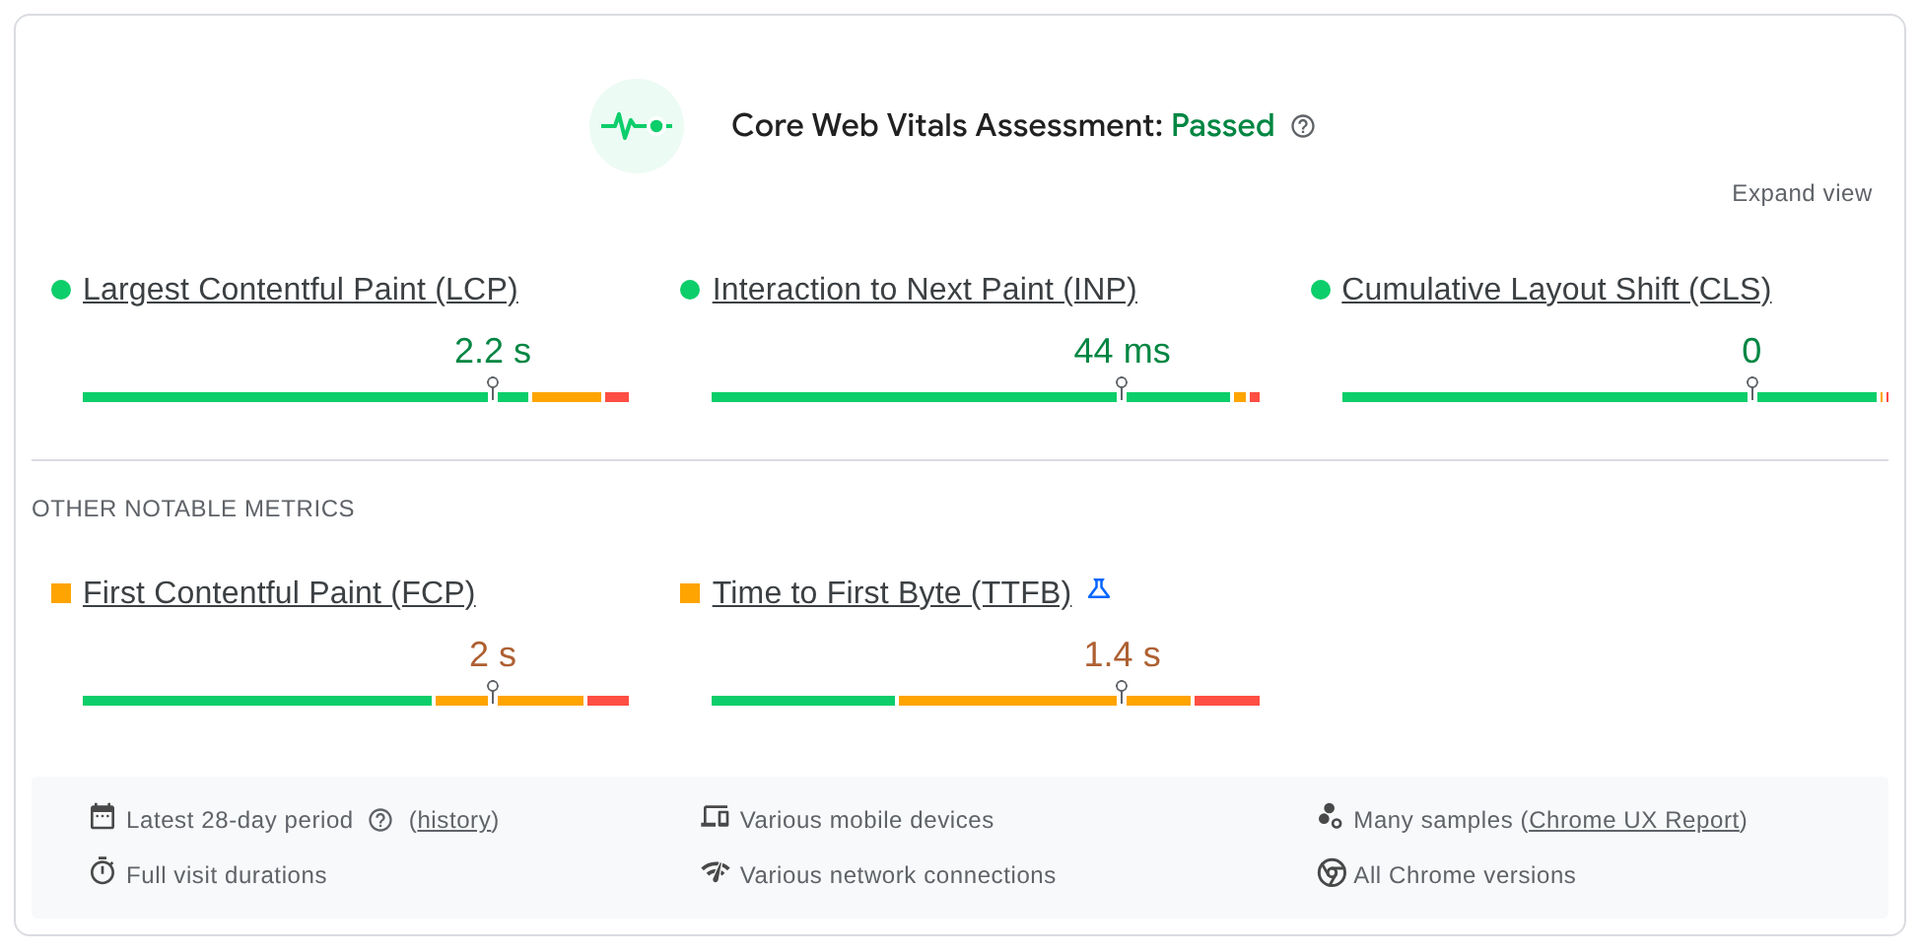
The result, as Google shows it.
Screenshots from the PageSpeed Insights report for https://codevibe.in/, run on 10 November 2026 at 7:57 PM IST on Lighthouse 13.6.0. The top half is a lab test on a simulated phone or desktop; the bottom half is 28 days of field data from real Chrome users.
What the 4 November report actually said.
Six findings from the saved Lighthouse report for the mobile homepage. Most of the cost came from what loaded alongside our own code.
One file was 95% of the page
The 4K hero film started downloading as soon as the page loaded. Of the 22,563 KiB Lighthouse measured on mobile, 21,528 KiB was that one video, fighting the rest of the page for bandwidth.
Tag Manager blocked the main thread
Google Tag Manager, with GA4 and Google Ads inside it, loaded 470 KiB of script during page load and accounted for 4.2 seconds of the 4.7 seconds of Total Blocking Time. LinkedIn Insight and Calendly added more.
Main-thread work on a mid-range phone
Scripts, style and layout work added up to 11.9 seconds of main-thread time across 62 requests. Taps during that window wait, which is exactly what Total Blocking Time measures.
Best Practices held down by third parties
Third-party cookies from the embedded scheduling widget and ad tags, plus issues logged in the browser's Issues panel, kept Best Practices at 79 on mobile and 78 on desktop.
Contrast failures
Small grey text on light backgrounds and faint labels on navy failed the 4.5:1 contrast ratio in 28 places on the homepage, holding Accessibility at 96 (91 on desktop, with small tap targets).
The LCP element waited in line
On mobile the largest paint was the header logo, a separate image request that waited 0.7 to 1.9 seconds behind other files before the browser could draw it.
Same page, six days apart.
Left: the Lighthouse 12.8 report we saved on 4 November, rendered from its JSON. Right: PageSpeed Insights on 10 November. Both use Lighthouse's simulated mobile or desktop settings.
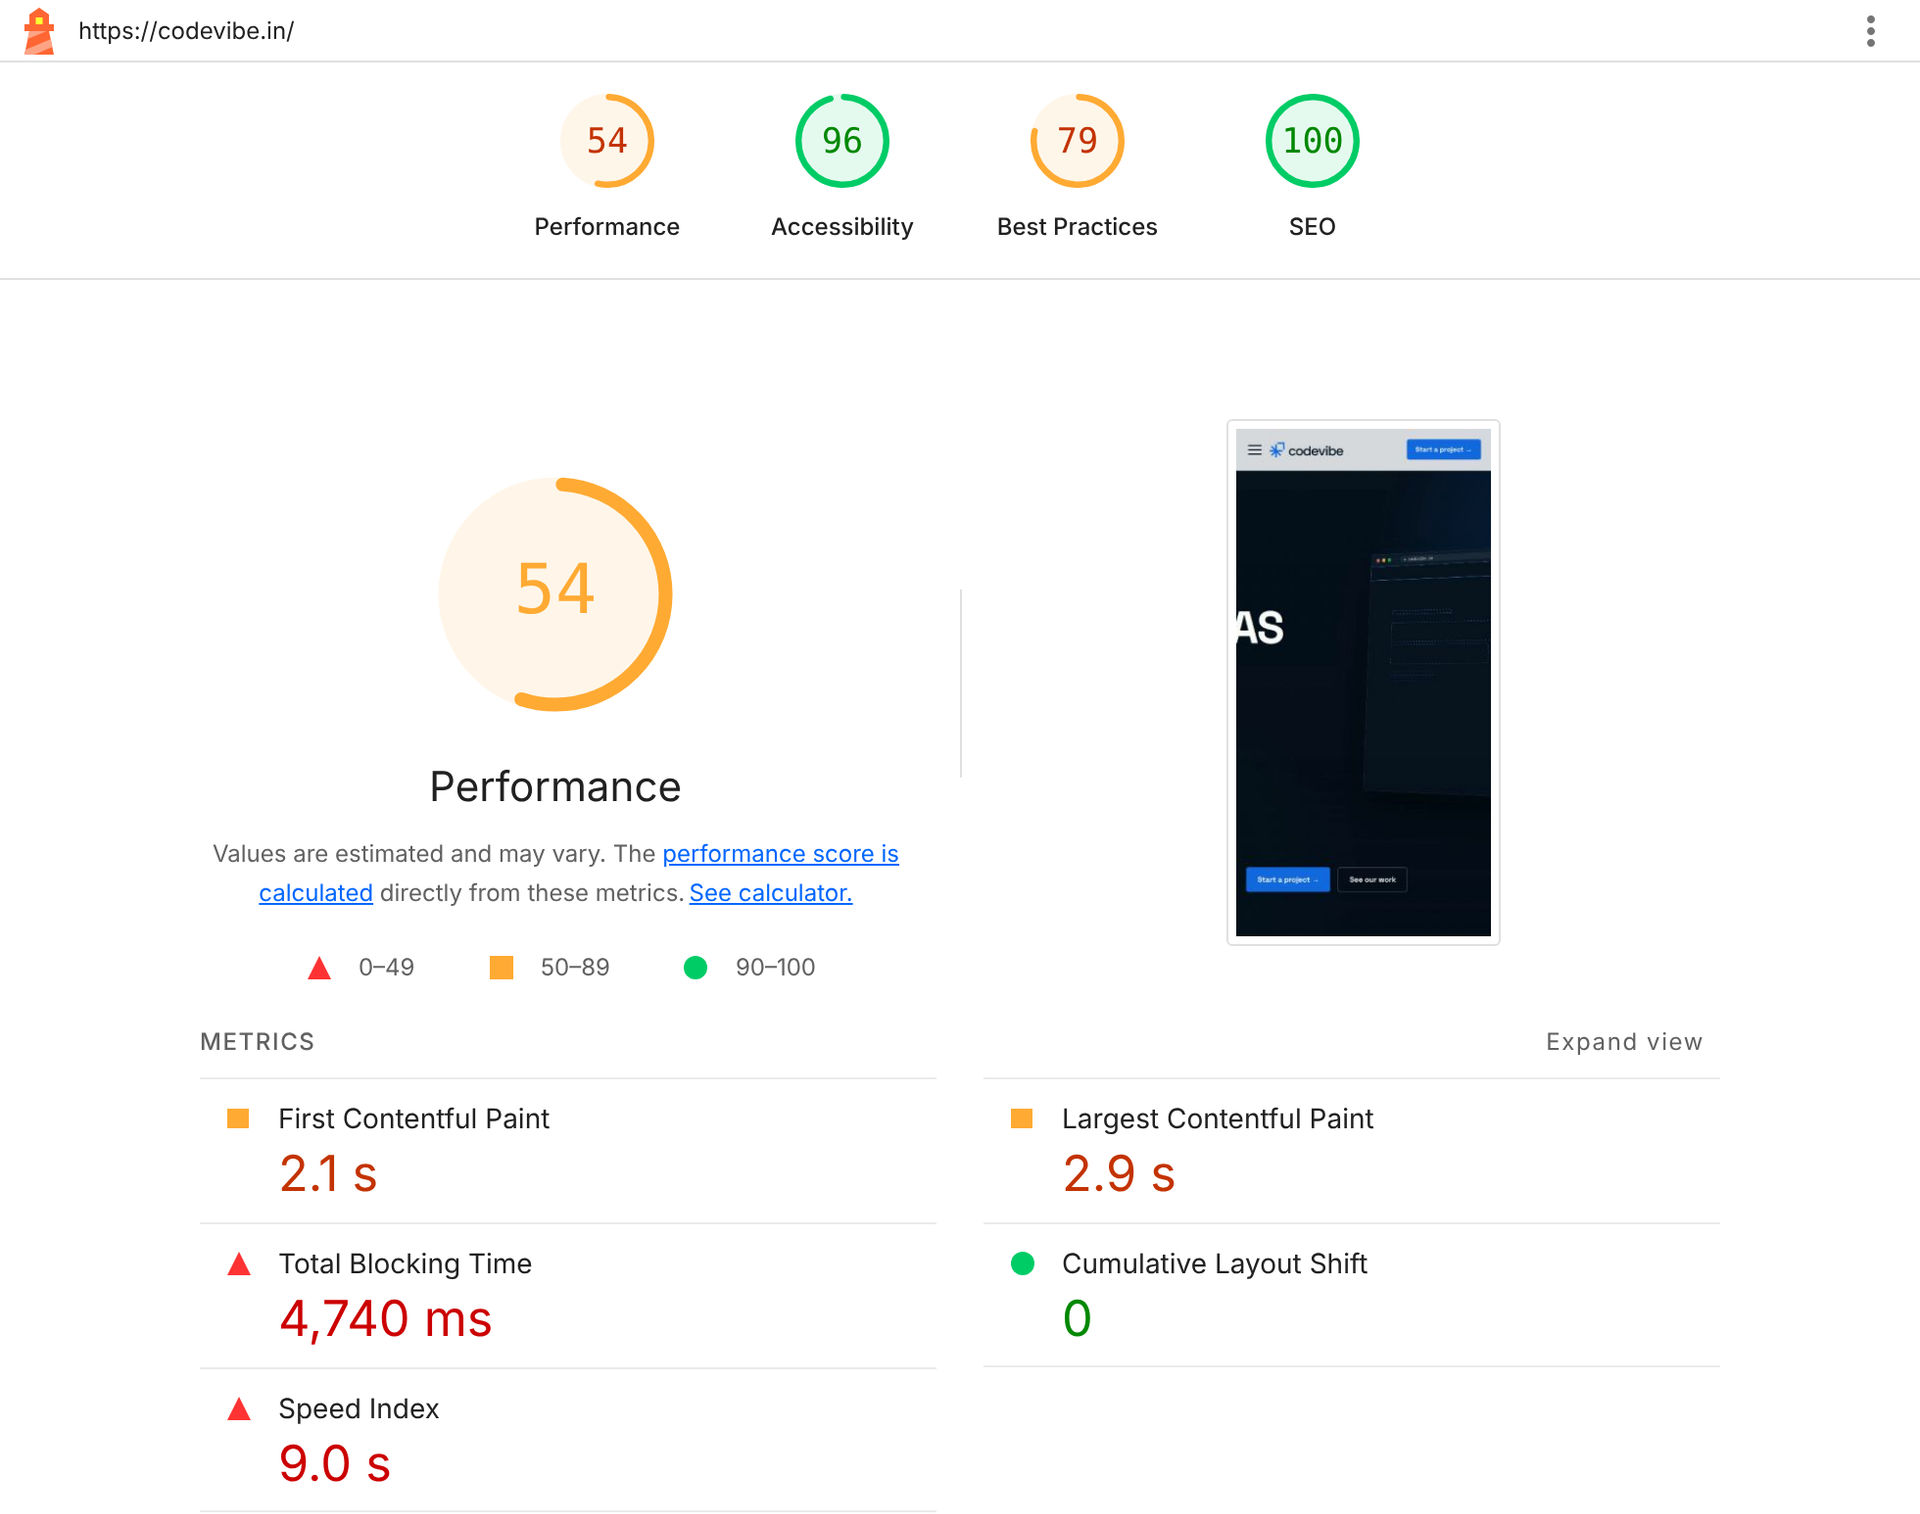
| Homepage, mobile | 4 Nov | 10 Nov |
|---|---|---|
| Performance score | 54 | 99 |
| First Contentful Paint | 2.1 s | 1.1 s |
| Largest Contentful Paint | 2.9 s | 1.9 s |
| Total Blocking Time | 4,740 ms | 30 ms |
| Speed Index | 9.0 s | 2.5 s |
| Cumulative Layout Shift | 0 | 0 |
| Accessibility · Best Practices · SEO | 96 · 79 · 100 | 100 · 100 · 100 |
Seven changes. The film and every tag stayed.
Measurement first, then the biggest cost first. Tap a step to expand it.
We ran Lighthouse three times per page on six templates (home, blog index, a blog post, a service page, a case study and the Gurugram location page), on mobile and desktop, and kept every JSON report. The median is what we compare against, so one lucky run cannot flatter the result. Real-user Core Web Vitals from the Chrome UX Report went alongside.
The hero now paints a small preloaded WebP poster. The original 4K film, unchanged and served through ImageKit with orig-true, starts on the visitor's first mouse move, touch, scroll, wheel or key press. Visitors who prefer reduced motion, or are on Data Saver or 2G, keep the poster. On upright phones and tablets the same film is shown whole, at full width, so its headline is never cropped. The film looks exactly as it did; it just stopped competing with everything else.
Google Tag Manager and the LinkedIn Insight Tag load on the first tap, key press or scroll, or 5 seconds after the page has loaded, whichever comes first. Every tag still fires for visitors who stay; roughly 480 KiB of script and about 4 seconds of blocking work left the loading window.
Calendly's widget script and stylesheet were injected on every page by the inquiry popup and the floating buttons, and set third-party cookies that counted against Best Practices. We removed it completely; the contact page and call-to-action bands now offer a direct call link, and the floating buttons keep WhatsApp.
The header logo, the mobile LCP element, became an 8 KB data URI inside the render-blocking CSS, so it paints with the first frame instead of waiting for its own request. Same PNG, pixel for pixel. The hero headline also stopped animating in, so it paints at its final position.
Images now go through ImageKit, which picks AVIF or WebP per browser and resizes to the slot through srcset. Files LiteSpeed serves straight from /public got long cache lifetimes through an .htaccess in /public, and the www host redirects in one hop.
One colour token moved from #64748B to #5F6E84 so small grey text passes 4.5:1. Faint labels on navy were lifted, decorative numbers moved into CSS, and the dot navigation got 24 px tap targets. Accessibility went to 100 on both form factors.
The code behind the green circles.
Short excerpts from the codevibe.in repository, trimmed for reading. Select a change to see how it works.
The 4K film waits for the visitor
The poster is in the HTML and preloaded. The film element is only given its source once the visitor interacts, and never on reduced motion, Data Saver or 2G. The file itself is the original upload, served by ImageKit without re-encoding.
The deferred tag loader is now open source as next-deferred-tags, with cookie consent and Google Consent Mode v2 added. The write-up of the tag fix is in Does Google Tag Manager slow down your Next.js site?
Not just the homepage, every template.
The fixes live in shared components, so they reached every page. Lighthouse medians of three mobile runs, 4 November against 10 November. The weight, request and main-thread rows are for the homepage.
Six templates: home, blog index, a blog post, a service page, a case study and the Gurugram location page. After the fixes each scores 89 to 95 in the median mobile run, with Accessibility, Best Practices and SEO at 100.
Key takeaways.
- Find the one file that matters. A single video was 95% of the homepage. No amount of minifying JavaScript would have moved the score while it loaded with the page.
- Defer, do not delete. The 4K film and every analytics and ad tag are still on the site. They just start when a person shows up, not when a test does.
- Third parties were the biggest cost. Third-party scripts caused 4,335 ms of the 4,740 ms of Total Blocking Time, most of it Tag Manager and the tags inside it. Loading them on intent took that out of the load.
- Report the median, show the receipts. Lab scores move between runs. We compare medians of three runs per template and link the PageSpeed report so anyone can check it.
Questions about this project.
In the PageSpeed Insights report captured on 10 November 2026, the codevibe.in homepage scored 99 for Performance and 100 for Accessibility, Best Practices and SEO on mobile, and 100 in all four categories on desktop. It also passed all three Agentic Browsing checks, and the Core Web Vitals Assessment from real Chrome users (28-day field data) passed on both mobile and desktop.
PageSpeed Insights runs Lighthouse on a simulated mid-range phone on a throttled connection, and small differences in server response, network and CPU timing move the score a few points. On the same day we saw the homepage score between 86 and 99 on mobile. That is why we report the median of three Lighthouse runs per page across six page templates (92 on average after the fixes, up from 58) as well as the single PageSpeed run shown here.
Yes, if the video is not part of the initial load. On codevibe.in the hero shows a small preloaded WebP poster, and the original 4K film starts only after the visitor's first interaction with the page. Lighthouse measures the load without interaction, so the 21,528 KiB of video it used to download is no longer counted, while real visitors still see the same film, unchanged.
No tags were removed. Google Tag Manager (with GA4 and Google Ads inside it) and the LinkedIn Insight Tag now load on the visitor's first tap, key press or scroll, or 5 seconds after the page has loaded, whichever comes first. The trade-off is that a visitor who leaves within 5 seconds without touching the page may not be recorded, which we accepted in exchange for taking about 4 seconds of blocking work out of the load.
Yes. A speed engagement starts with a measured audit (Lighthouse on every page template, real-user Core Web Vitals and a list of what each script and file costs), followed by fixes in priority order. Audits usually take 1 to 2 weeks and technical fixes 2 to 4 weeks, depending on how much third-party script, video and legacy code a site carries. Our own site took six days from audit to the report shown here.
Is your site still orange?
We measure every template, find the files and scripts that cost the most, and fix them in order, without removing what your visitors or your marketing team rely on.